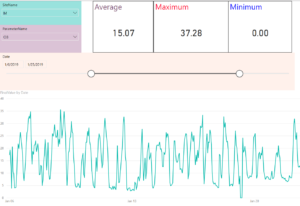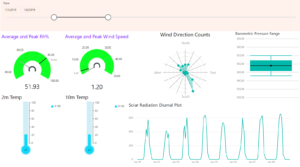
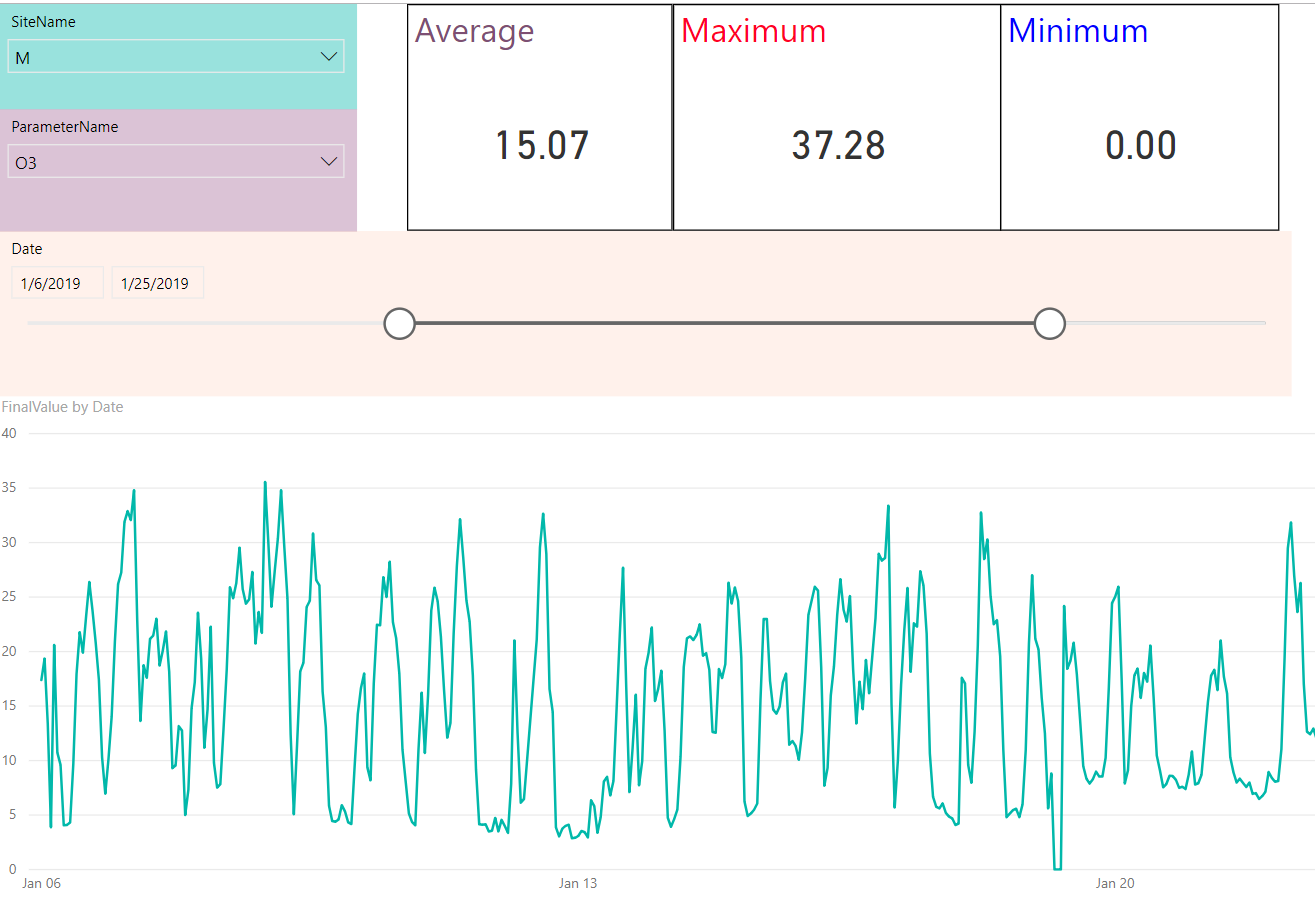
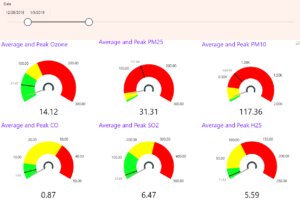
AirVision can be easily with powerful visualization tools like Microsoft Power Business Intelligence (Power BI) to create dynamic dashboards like the following. A tutorial video below shows the basics of using Power BI, but Agilaire also offers Dashboard development as a service. Contact info@agilaire.com for more details.
Tutorial Links on Data Visualization Using Microsoft BI
- If unable to stream, right click and “save video as” to view on your local machine.
- To view in full screen mode, right click the square on bottom right of video when cursor hovers video.