
Overview
One web interface, three jobs.
Public-facing System
Customizable public displays
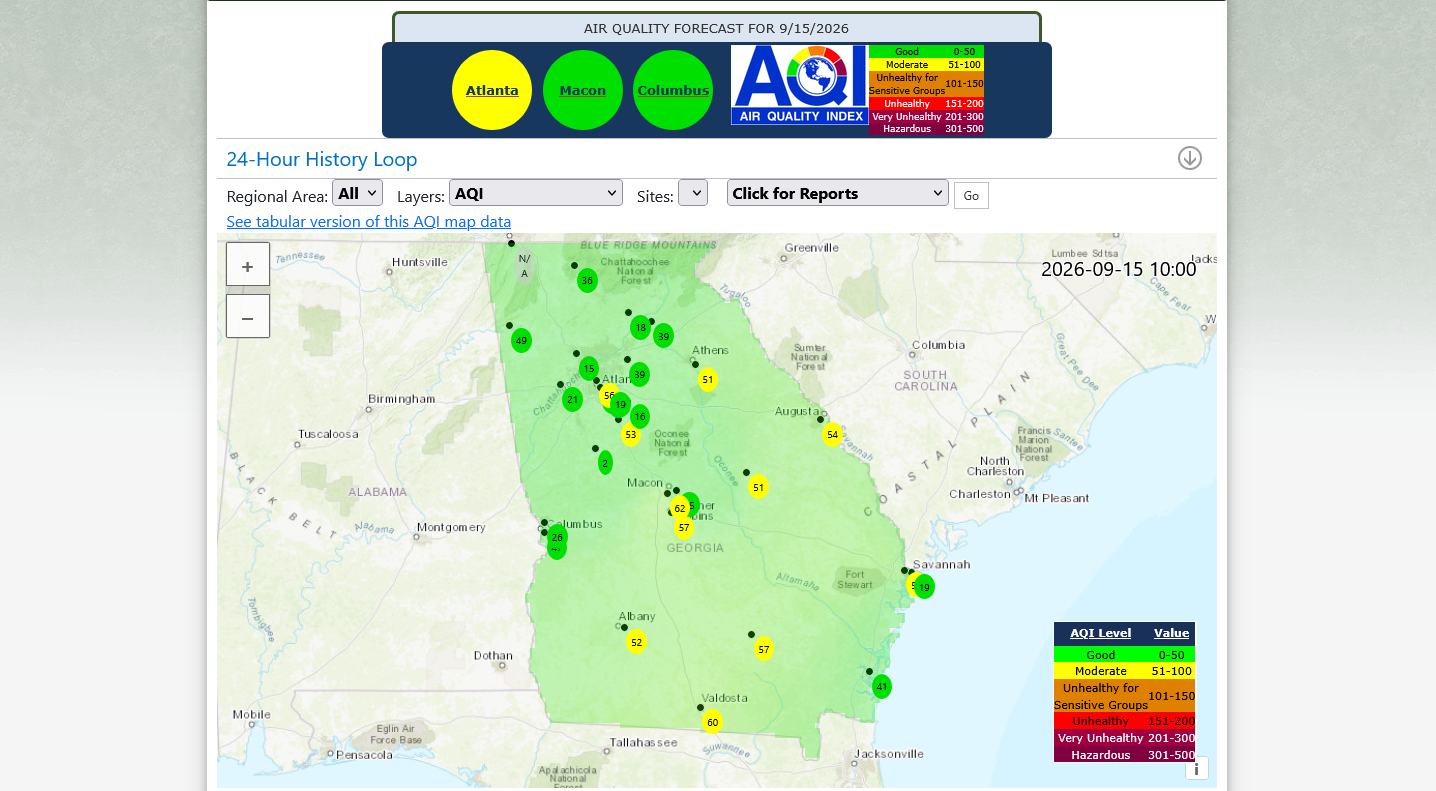
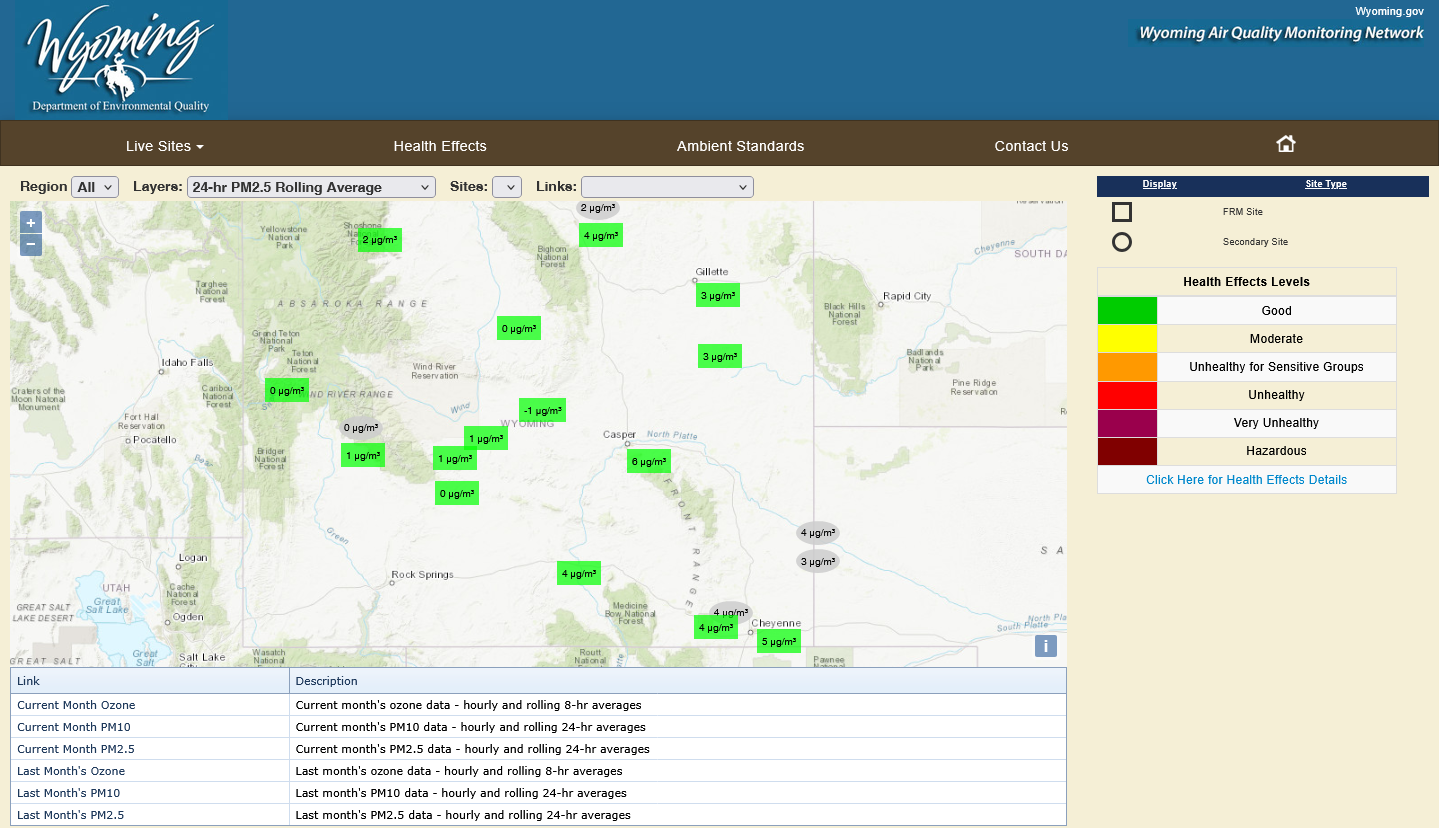
Central map display
An overall map display with a color-coded marker at each site showing its AQI value. Rolling over a marker pops up the responsible pollutant and its concentration. Visitors click a site to drill into detail, or choose a climate region to see the AQI for that region as a whole.
- Color coding follows the standard AQI categories the public already recognizes
- Optional contour map layer
- Concentration and value layers can be offered alongside AQI
Site detail faces
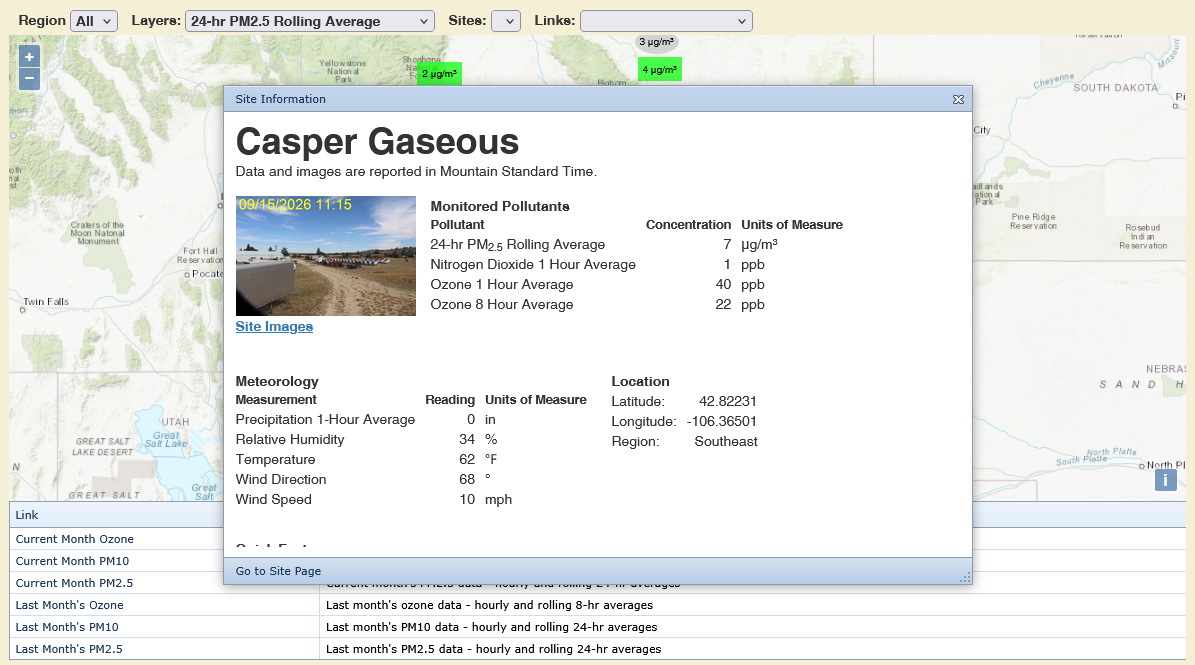
Every site name on the map links to its own page: the latest value for all pollutants, AQI for the previous hours, a photo of the site, the instruments and pollutants monitored there, its location, and whatever narrative detail you want residents to have about that location.
- Answers “what is the monitor near me measuring?” without a phone call
- Site photos and narrative text are yours to write and change
- Graphs of recent hours render in the browser — no plug-in, no download
Internal Tool
AirVision, over the web.
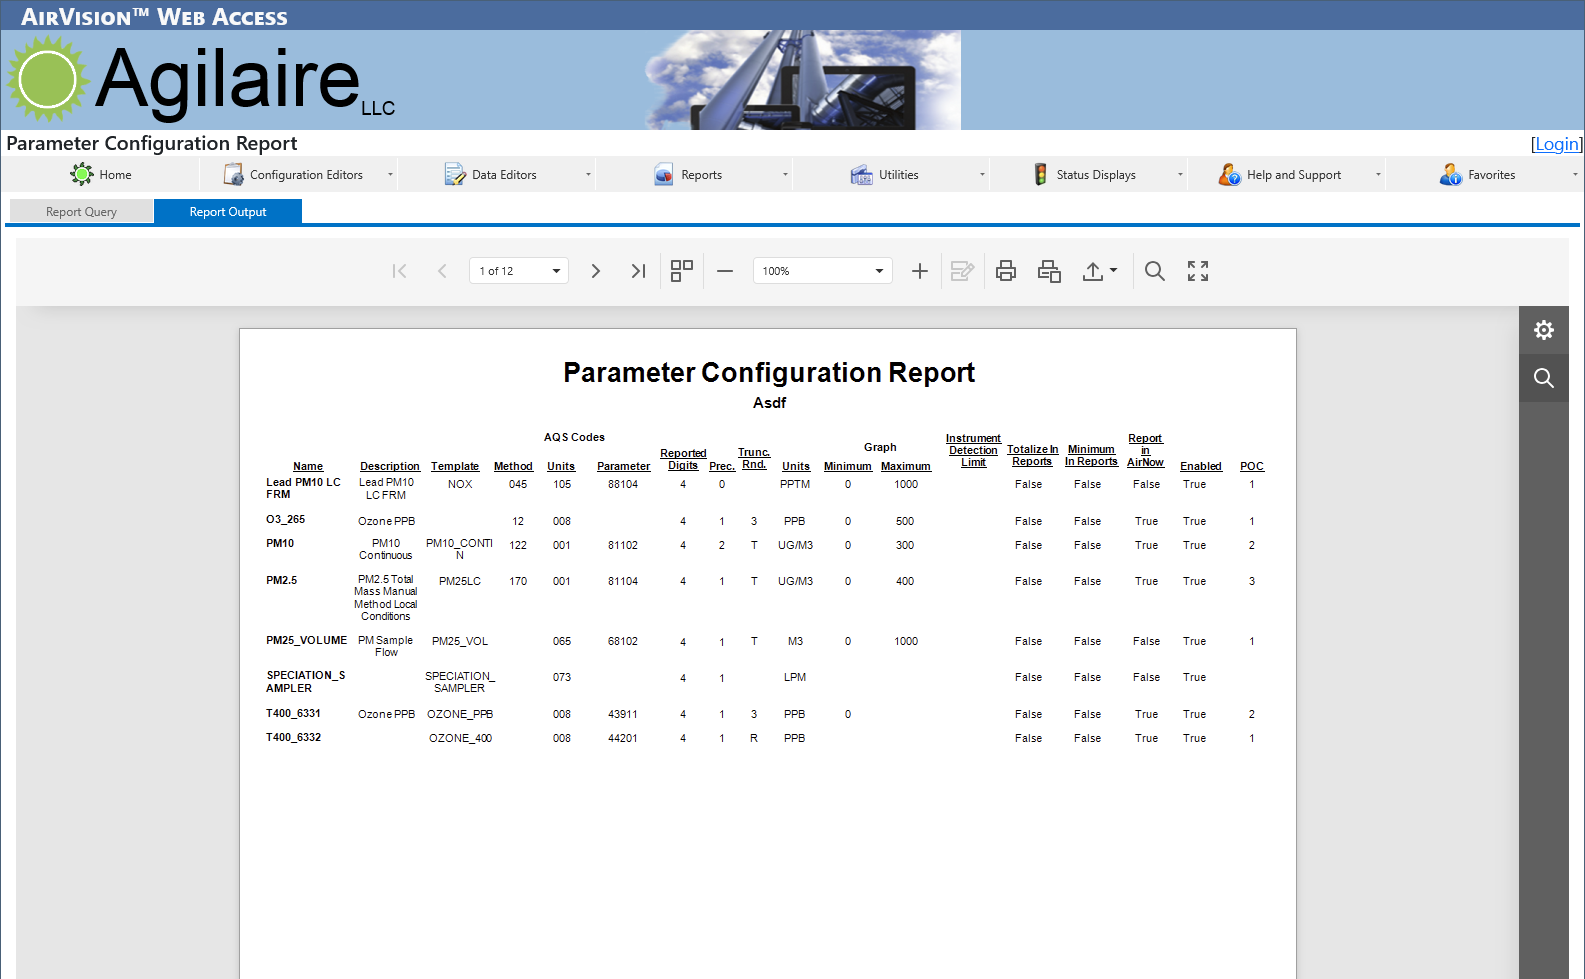
AgileWeb doesn’t ask you to rebuild your reporting. Any AirVision report can be exposed in a web menu, or published as a fixed hyperlink with the parameters and date range already set — a standing “last month’s ozone summary” link a reporter or a council office can bookmark.
- Public internet reporting — historical data residents can generate for themselves
- Internal intranet reporting — the same web-based reporting for staff across your agency who don’t have the AirVision client
- Predefined reports — fixed parameters and date ranges behind a static link
- Menu-driven reports — let users choose the report, pollutants, and period
AQS and Exchange Node data flow
AgileWeb moves AQS data in both directions — import and export, in text and XML 2.0 format — so it interfaces fully with NEIEN Exchange Nodes. It also gives data to partners and programs that don’t have Exchange Node access of their own, which is where most agencies end up doing this work by hand.